
We dug up Australian weather records back to 1838 and found snow is falling less often
As we slowly emerge from lockdown, local adventures are high on people’s wish lists. You may be planning a trip to the ski fields, or even the nearby hills to revel in the white stuff that occasionally falls around our southern cities after an icy winter blast.
Our new research explores these low-elevation snowfall events. We pieced together weather records back to 1838 to create Australia’s longest analysis of daily temperature extremes and their impacts on society.
These historical records can tell us a lot about Australia’s pre-industrial climate, before the large-scale burning of fossil fuels tainted global temperature records.
They also help provide a longer context to evaluate more recent temperature extremes.
We found snow was once a regular feature of the southern Australian climate. But as Australia continues to warm under climate change, cold extremes are becoming less frequent and heatwaves more common.

David Mariuz/AAP
Extending Australia’s climate record
Data used by the Bureau of Meteorology to study long-term weather and climate dates back to the early 1900s. This is when good coverage of weather stations across the country began, and observations were taken in a standard way.
But many older weather records exist in national and state archives and libraries, as well as local historical societies around the country.
We analysed daily weather records from the coastal city of Adelaide and surrounding areas, including the Adelaide Hills, back to 1838. Adelaide is the Australian city worst affected by heatwaves, and the capital of our nation’s driest state, South Australia.
To crosscheck the heatwaves and cold extremes identified in our historical temperature observations, we also looked at newspaper accounts, model simulations of past weather patterns, and palaeoclimate records.
The agreement was remarkable. It demonstrates the value of historical records for improving our estimation of future climate change risk.
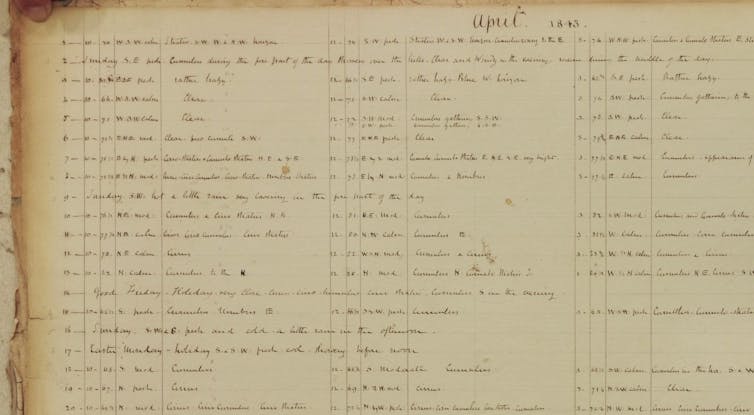
National Archives of Australia
‘Limpness to all mankind’
While most other historical climate studies have looked at annual or monthly values, the new record enabled us to look at daily extremes.
This is important, because global temperature increases are most clearly detected in changes to extreme events such as heatwaves. Although these events may only last a few days, they have very real impacts on human health, agriculture and infrastructure.
Our analysis focused on the previously undescribed period before 1910, to extend the Bureau of Meteorology’s official record as far as possible.
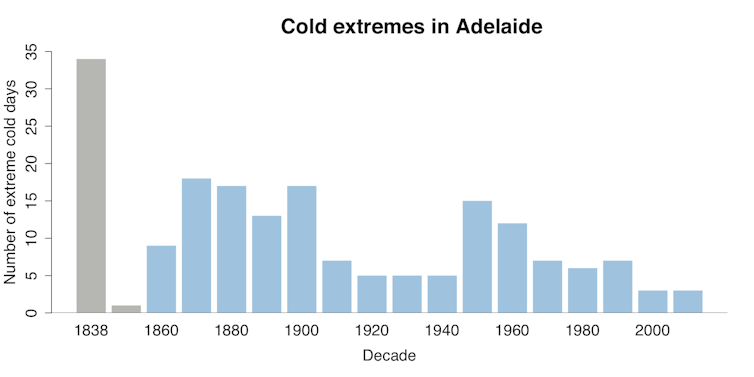
Using temperature observations, we identified 34 historical heatwaves and 81 cold events in Adelaide from 1838–1910. We found more than twice as many of these “snow days” by conducting an independent analysis of snowfall accounts in historical documents.
Almost all the events in the temperature observations were supported by newspaper reports. This demonstrated our method can accurately identify historical temperature extremes.
For example, an outbreak of cold air on June 22, 1908, delivered widespread snow across the hills surrounding Adelaide. The Express and Telegraph newspaper reported:
Many people made a special journey from Adelaide by train, carriage, or motor to revel in the unwonted delight of gazing on such a wide expanse of real snow, and all who did so felt that their trouble was amply rewarded by the panorama of loveliness spread out before their enraptured eyes.
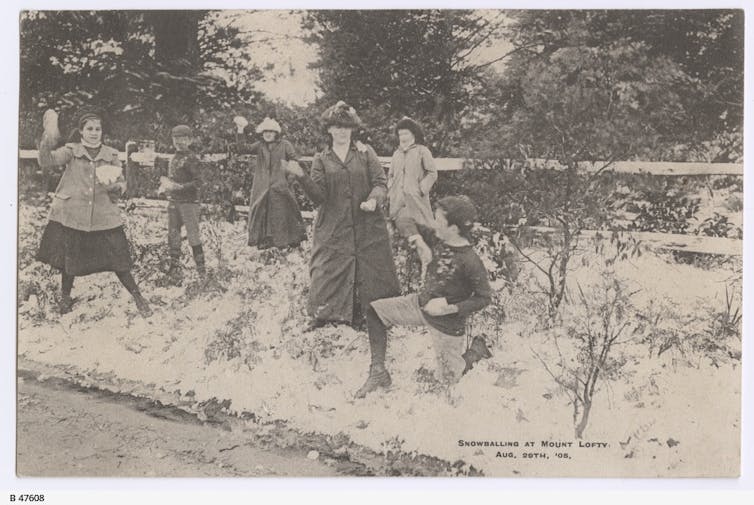
Source: State Library of South Australia
From December 26-30, 1897, Adelaide was gripped by a heatwave that produced five days above 40℃. Newspapers reported heat-related deaths, agricultural damage, animals dying in the zoo, bushfires and even “burning hot pavements scorching the soles of people’s shoes”. As The Advertiser reported:
When the mercury reaches its “century” (100℉ or 37.6℃) there must be a really uncomfortable experience for everyone. One such day can be struggled with; but six of them in a fortnight, three in succession — that is a thing to bring limpness to all mankind.
On December 31, 1897, the South Australian Register wrote prophetically of future Australian summers:
May Heaven preserve us from being here when the “scorchers” try and add a few degrees to the total.
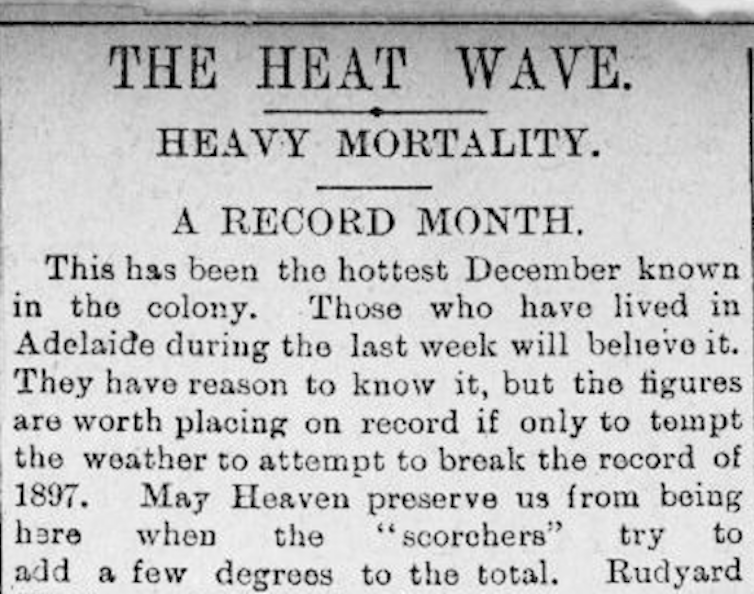
National Library of Australia
A longer view
While Australia has a long history of hot and cold extremes, our extended analysis shows that their frequency and intensity is changing.
The quality of the very early part of the record is still uncertain, so the information from the 1830s and 1840s must be treated with caution. That said, there is excellent agreement with newspaper and other historical records.
Our research suggests low-elevation snow events around Adelaide have become less common over the past 180 years. This can be seen in both temperature observations and independent newspaper accounts. For example, snowfall was exceptionally high in the 1900s and 1910s — more than four times more frequent than other decades.
We also found heatwaves are becoming more frequent in Adelaide. The decade 2010–19 has the highest count of heatwaves of any decade in the record. Although recent heatwaves are not significantly longer than those of the past, our analysis showed heatwaves of up to ten days are possible.
Previous Australian studies have identified an increase in extreme heat and a corresponding decrease in cold events. However, this is the longest analysis in Australia, and the first to systematically combine instrumental and documentary information.
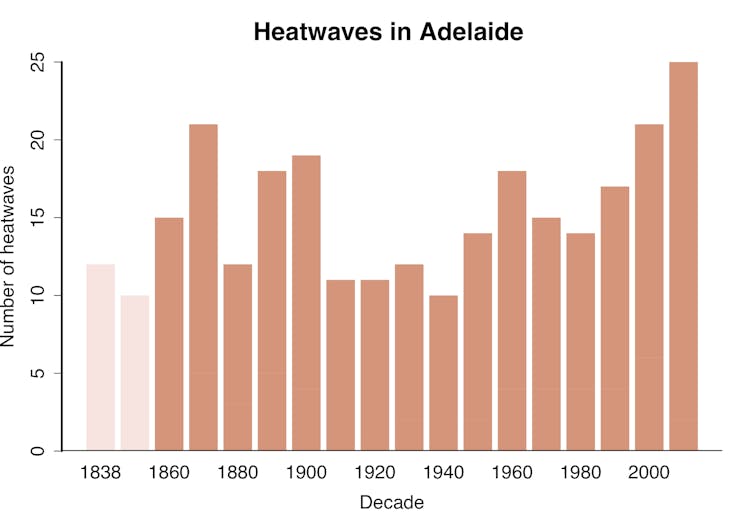
Author supplied
Author supplied
Learning from the past
This study shows we can use historical weather records to get a better picture of Australia’s long-term weather and climate history. By using different sources of information, we can piece together the significant events in our climate history with greater certainty.
Historical records tell us about more than just exciting day trips of the past. They also hold the key to understanding impacts of extreme events, such as heat-related deaths or agricultural damage, in the future.
A better understanding of these pre-industrial extremes will help emergency management services better adapt to increased climate risk, as Australia continues to warm.![]()
Written by Joelle Gergis, Senior Lecturer in Climate Science, Australian National University and Linden Ashcroft, Lecturer in climate science and science communication, University of Melbourne
This article is republished from The Conversation under a Creative Commons license. Read the original article.


